AR DXP
Embedded temporal data visualizations in an urban environment for casual exploration.
Our project focuses on enhancing casual urban data engagement by integrating dynamic visualizations directly into cityscapes through augmented reality. This approach leverages mobile technology to improve public understanding and interaction with urban data, ultimately aiming to enrich the user experience in real-world settings.
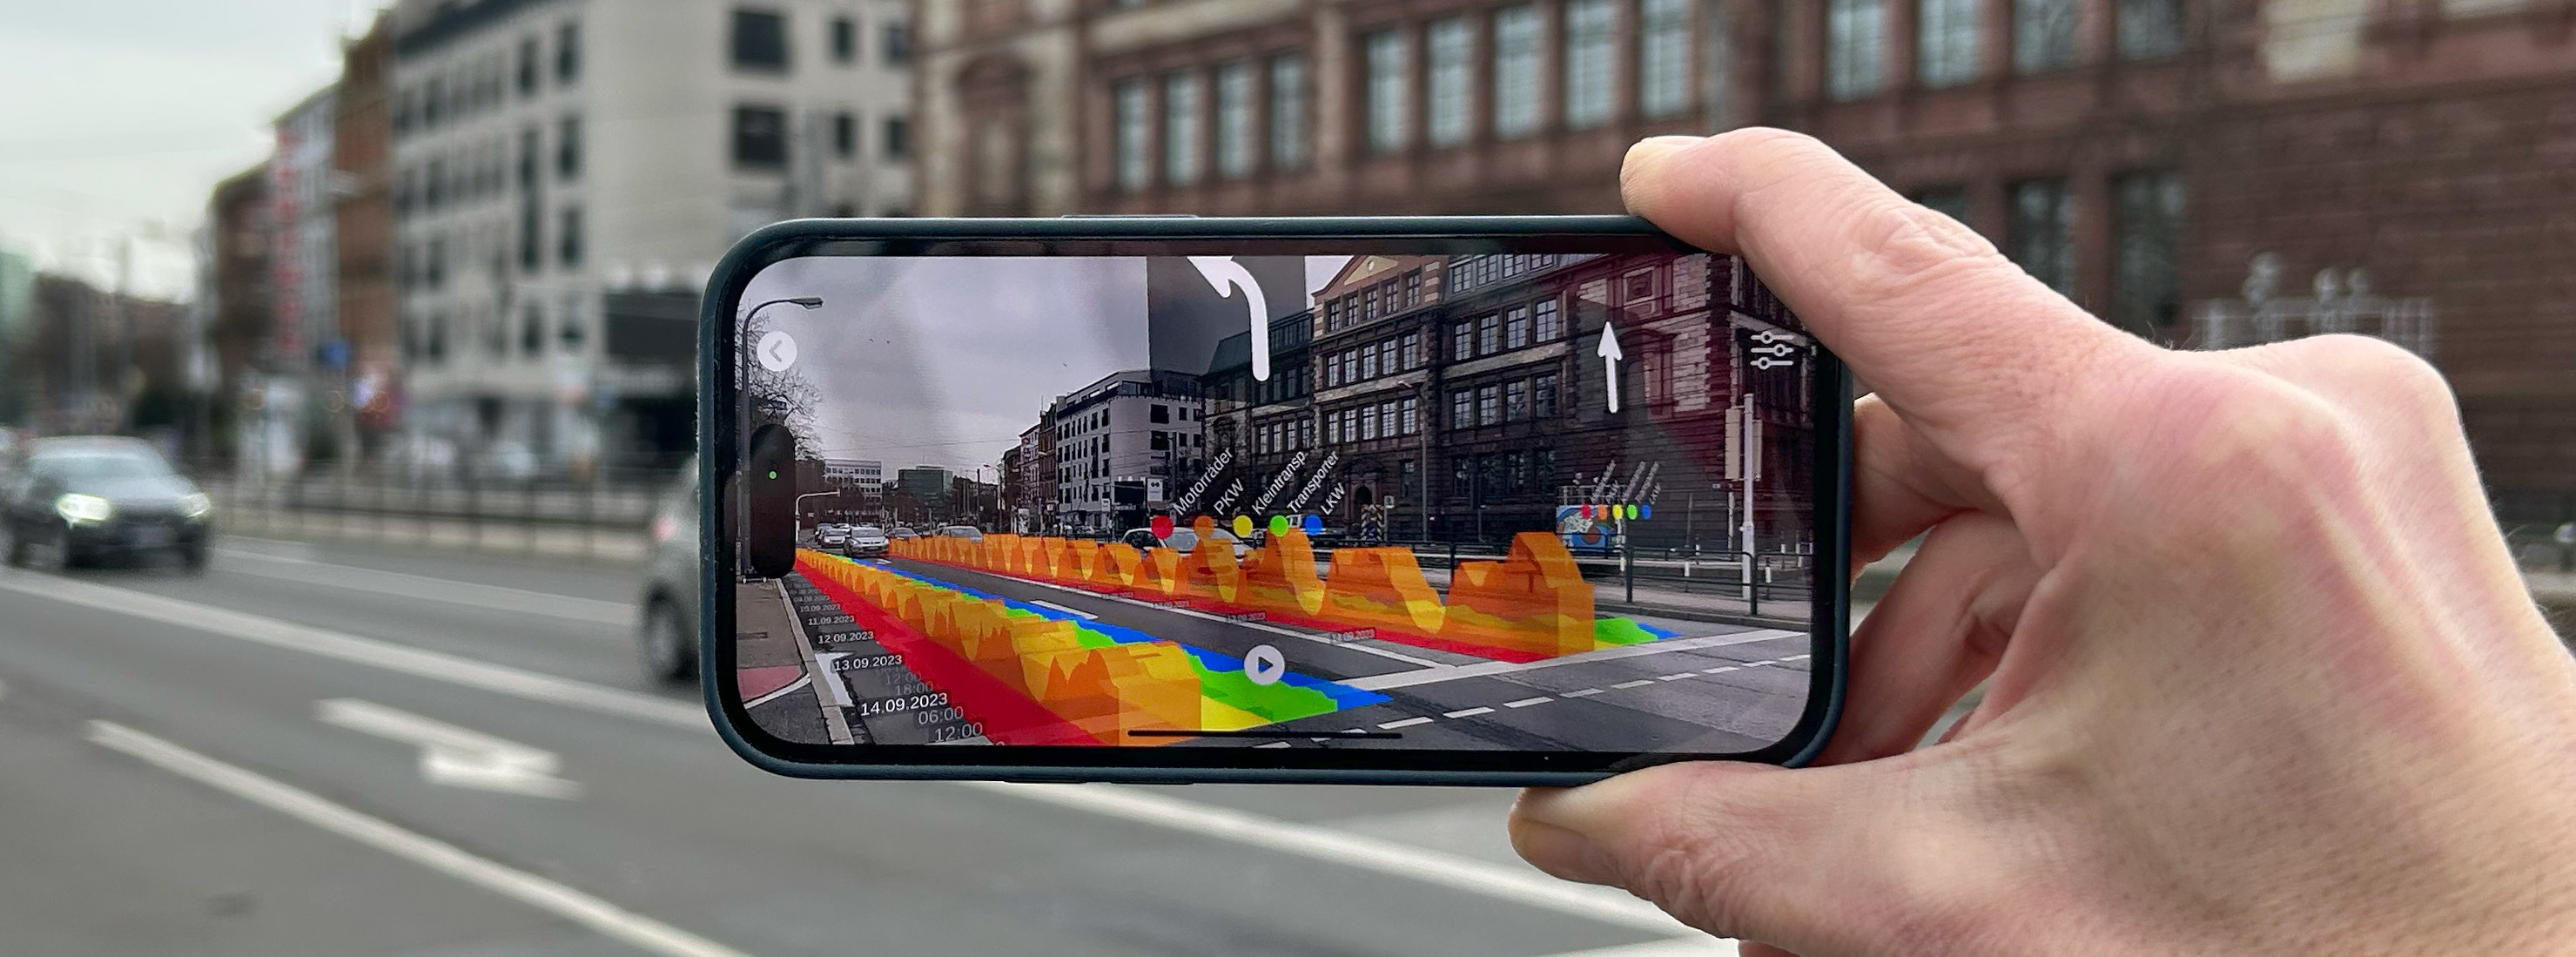
Hand-held mobile device displaying a grouped area chart embedded onto the street visualizing the progression of traffic by type for two lanes. Time labels are shown along their axis, with arrows and legends hovering slightly over-head.
Design concept and characteristics
In our exploration of a design space for situated visualizations of temporal data in an urban environment, we focus on crafting experiences where the visualization is intricately tied to its physical and perceptual context and introduce an early design concept, and its characteristics:
-
Temporal Directionality: Rendering temporal data in embedded visualizations challenges the conventional representation of time. It accounts for cultural differences in perceiving time and investigates how the observer’s position can alter perceived flow directions in visualizations.
-
Temporal Situatedness: Refers to the alignment of the data’s temporal context with the actual observation time, enhancing relevance and immediacy. It differentiates between live, historic, and predictive data, emphasizing temporal situatedness for its immediate contextual alignment in urban environments.
-
Spatial Proportions: This aspect combines abstract data visualization methods with real-world scales, such as adapting a visualization’s scale to match the dimension of a building. This integration helps link data more intuitively to physical urban elements, enriching user interaction and comprehension.
-
Visualization Idioms: Focuses on selecting and refining visualization techniques suitable for embedding data into urban contexts. This includes choosing between discrete or continuous temporal scales, deciding the cardinality of the viewpoint, and effectively using spatial positioning to represent different data attributes like traffic volume.
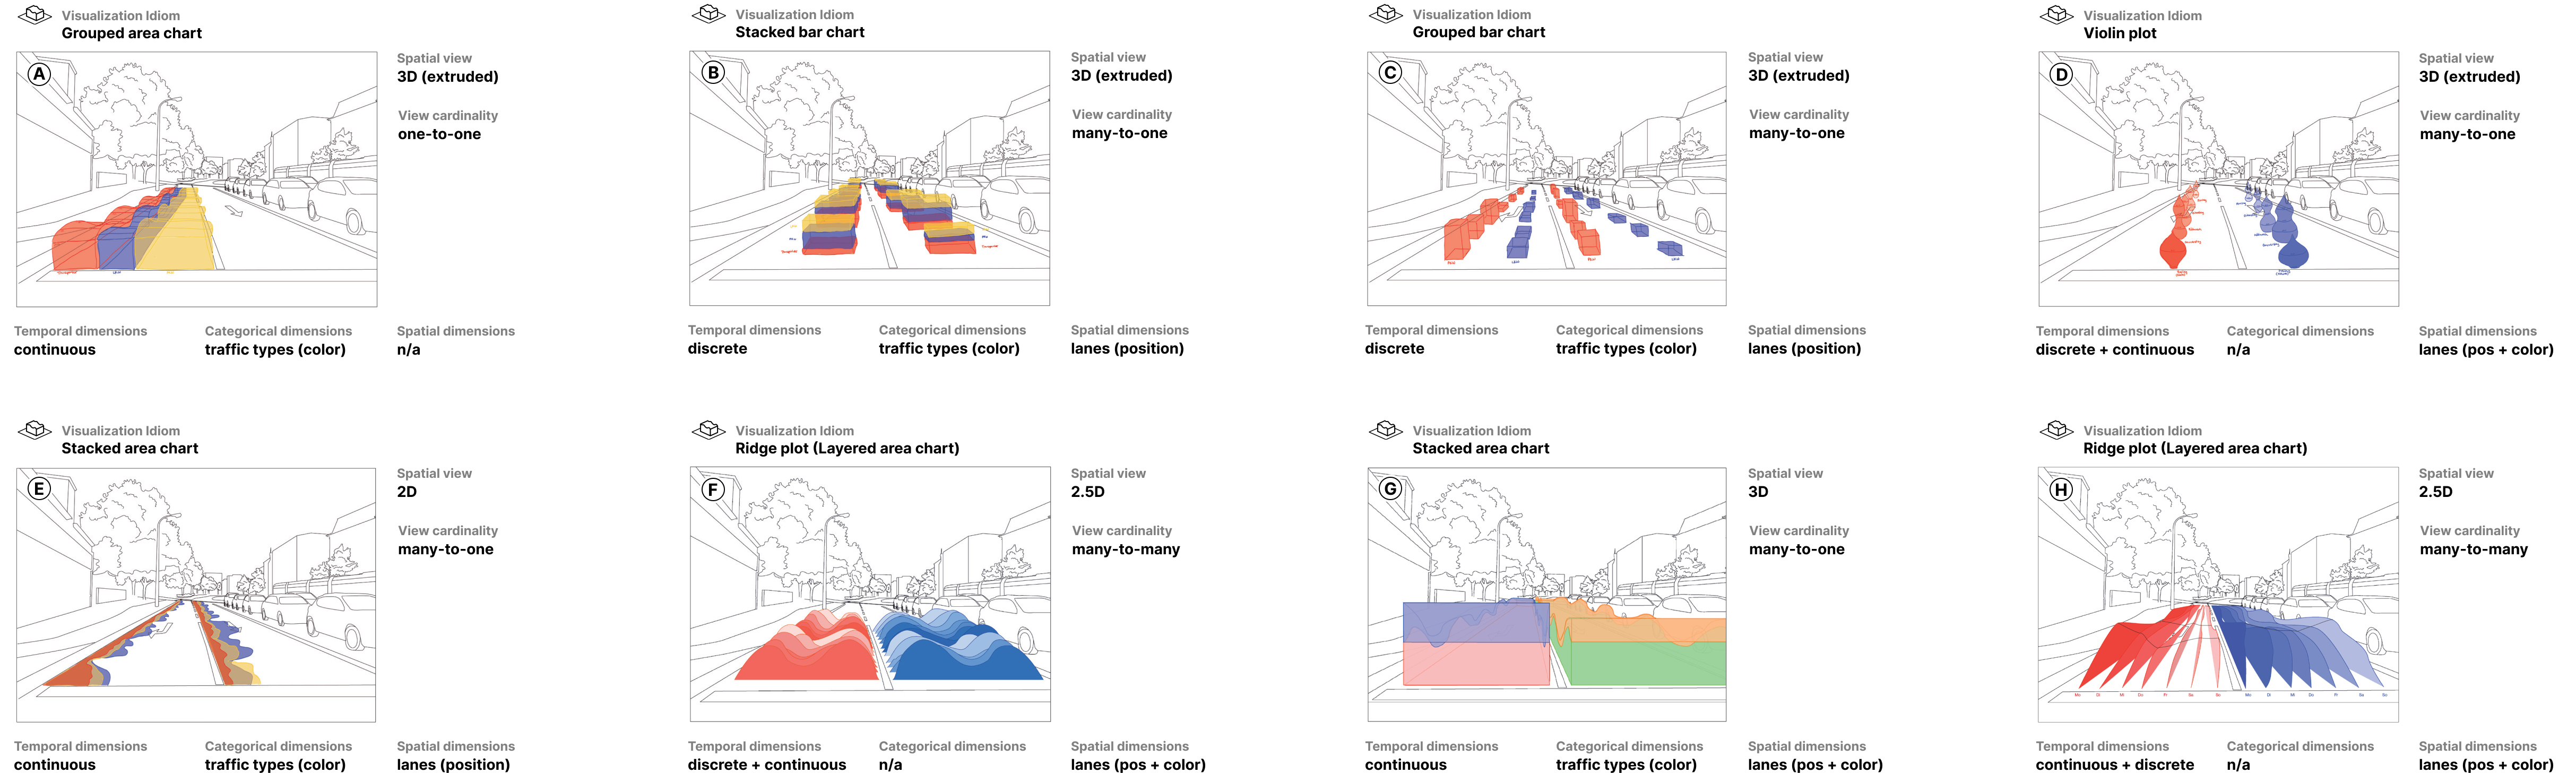
Explorations of various visualization idioms for the case of traffic data embedded into the street lanes, ranging from continuous grouped area charts, to discrete stacked bar charts, to grouped bar charts, to violin plots, to flat area charts, to layered area charts for multiple time axes.
The demonstrator
We demonstrate the feasibility of our designs in real-world settings through a mobile application utilizing location-based augmented reality.
In our demonstrator, we chose street-level traffic such as cars, motorcycles, and trucks, due to their prevalence in central urban locations and their proximity to pedestrians. We used computer-vision based tracking systems installed at locations that track and classify individual vehicles into traffic categories from our Smart City project in Mannheim.
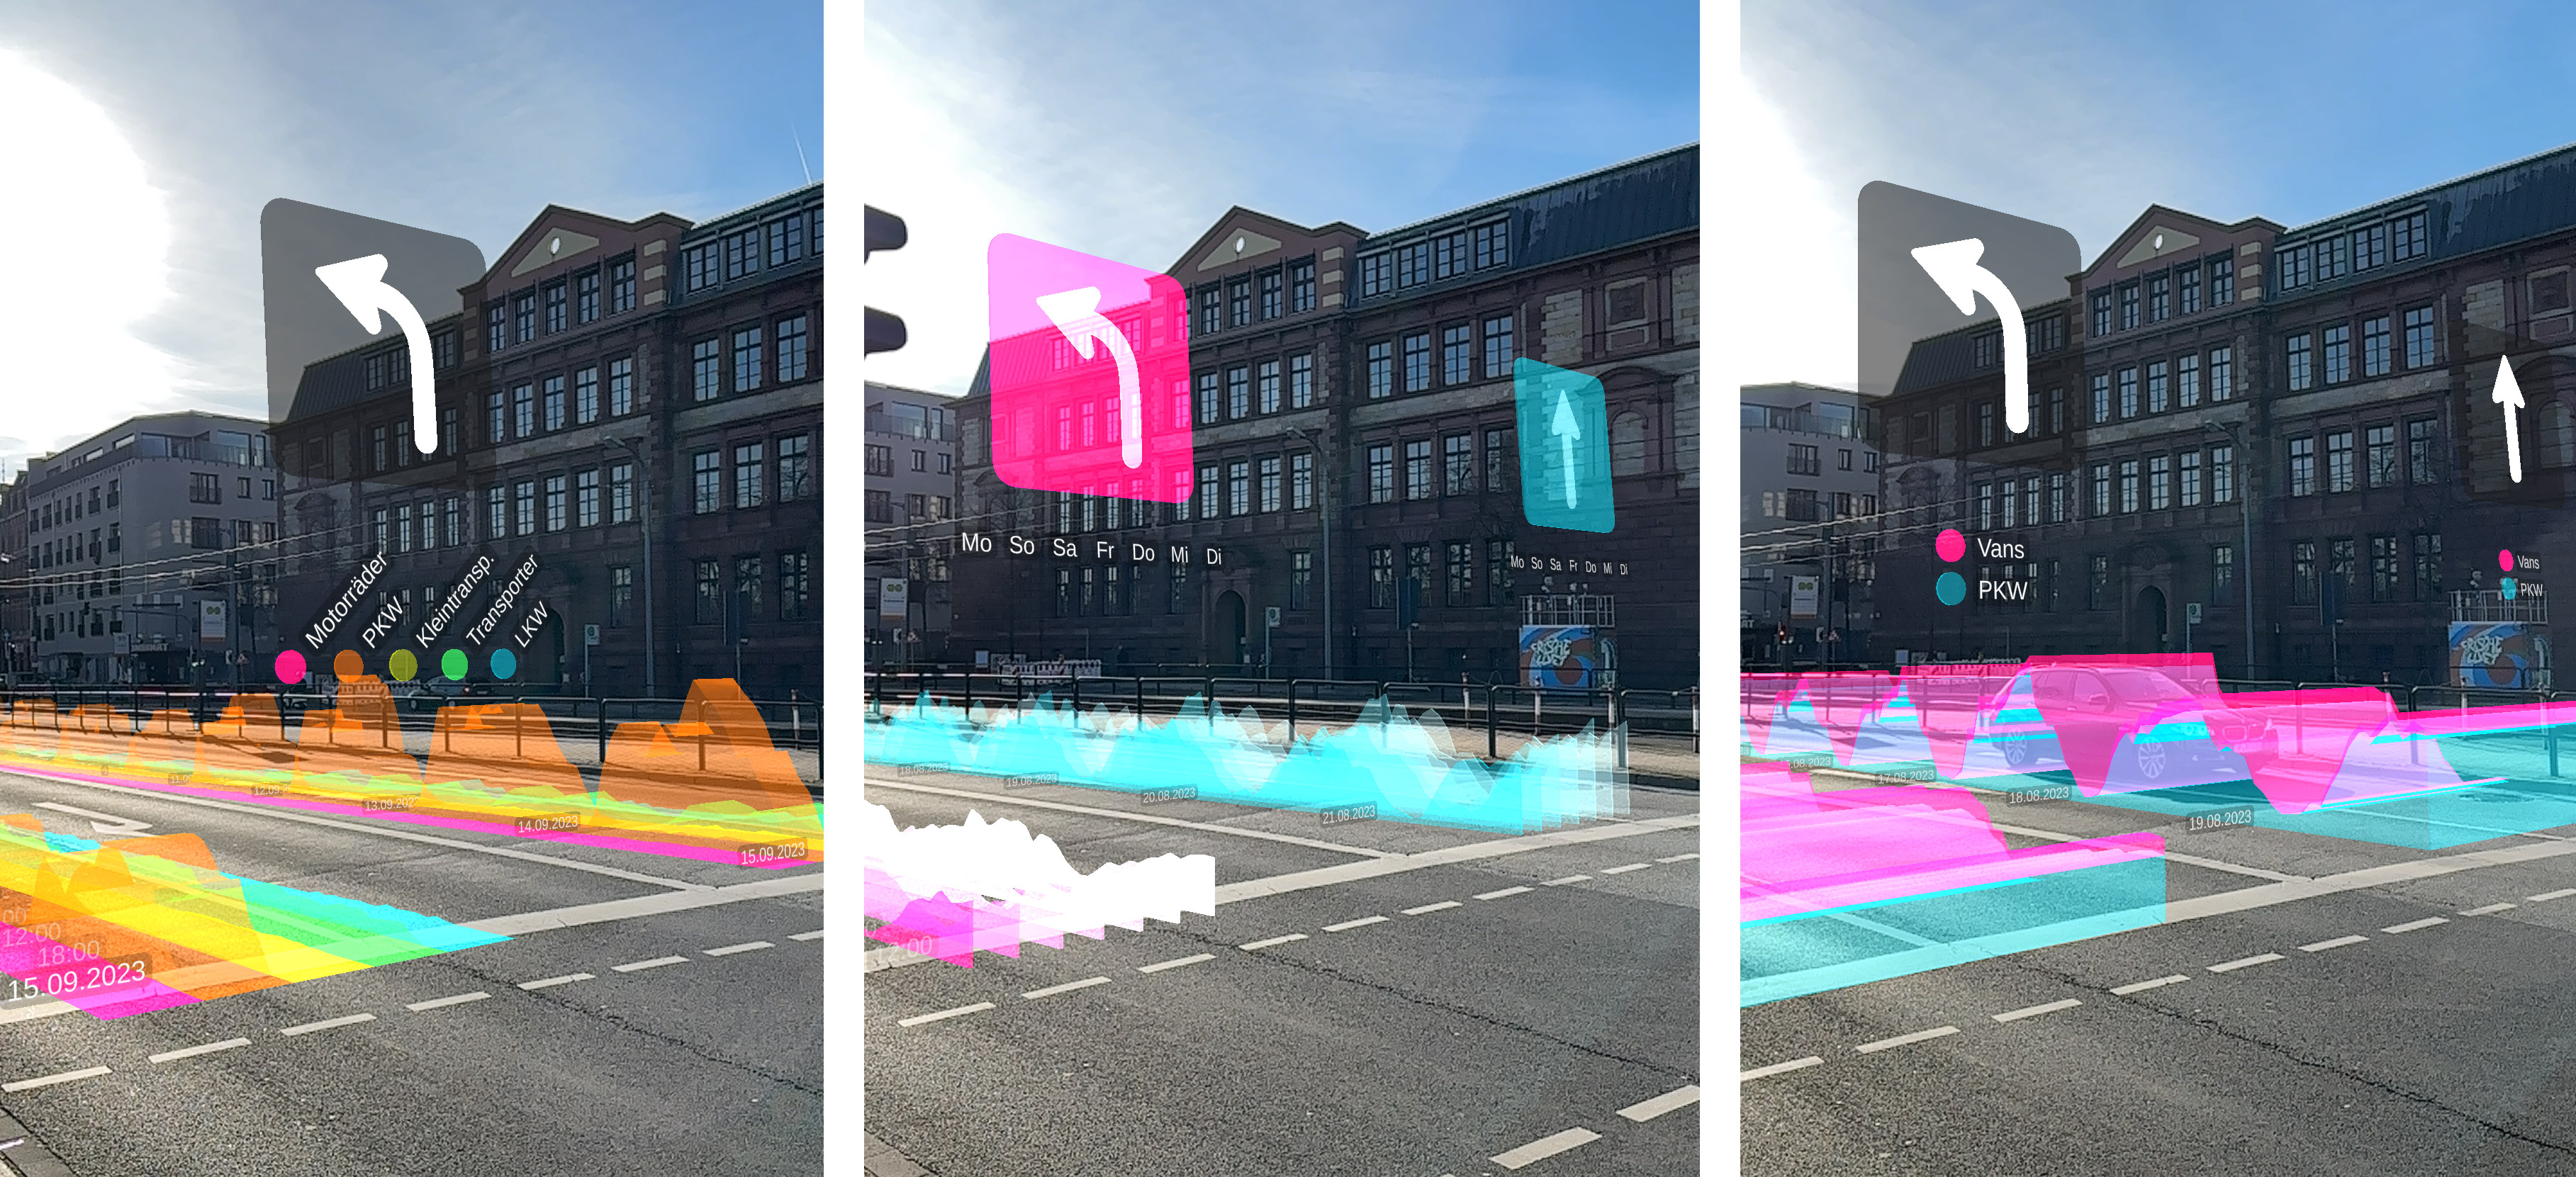
All views visualize traffic progression for the two lanes, featuring a grouped area chart with color coding explained in the legend (left), a ridge plot capturing traffic frequency across two temporal granularities (center), and a stacked area chart for two types of traffic (right).
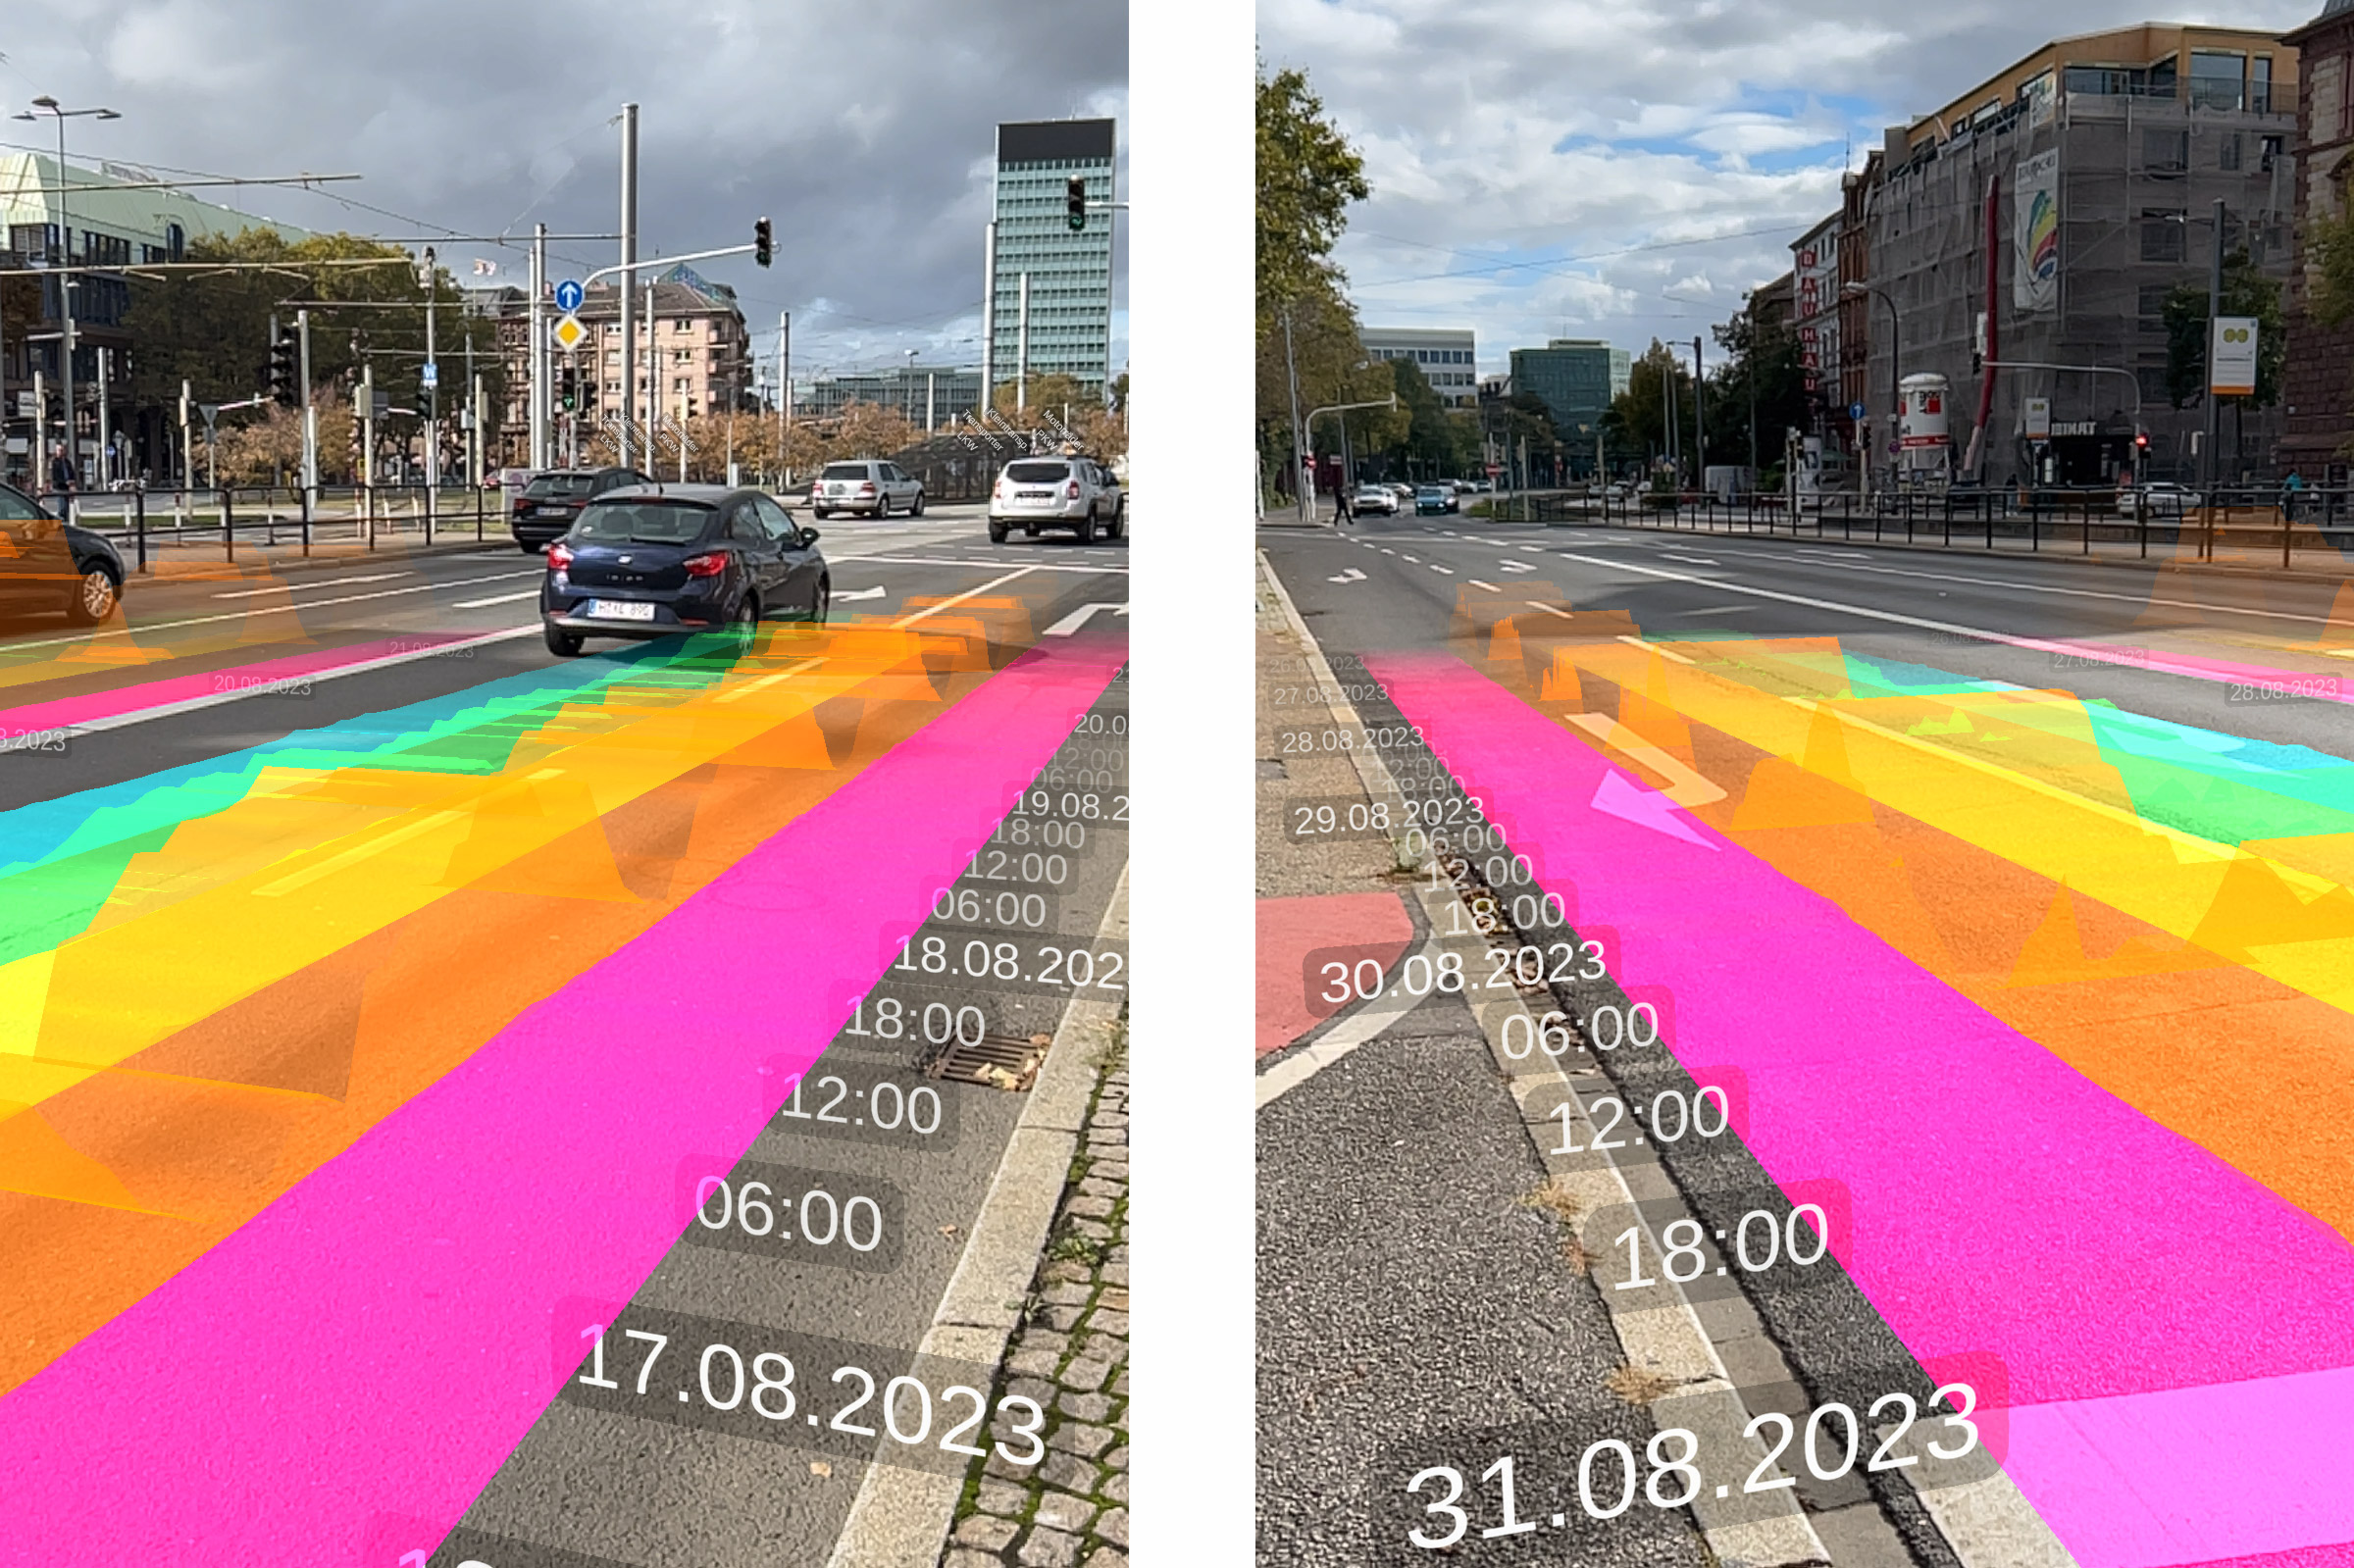
While the labels are always oriented towards the viewer, the temporal directionality depends on the viewer’s perspective and can change from recent-at-back (left) to recent-at-front (right).