cf. city flows
cf. city flows is a comparative visualization environment of urban bike mobility designed to help citizens casually analyze three bike-sharing systems in the context of a public exhibition space
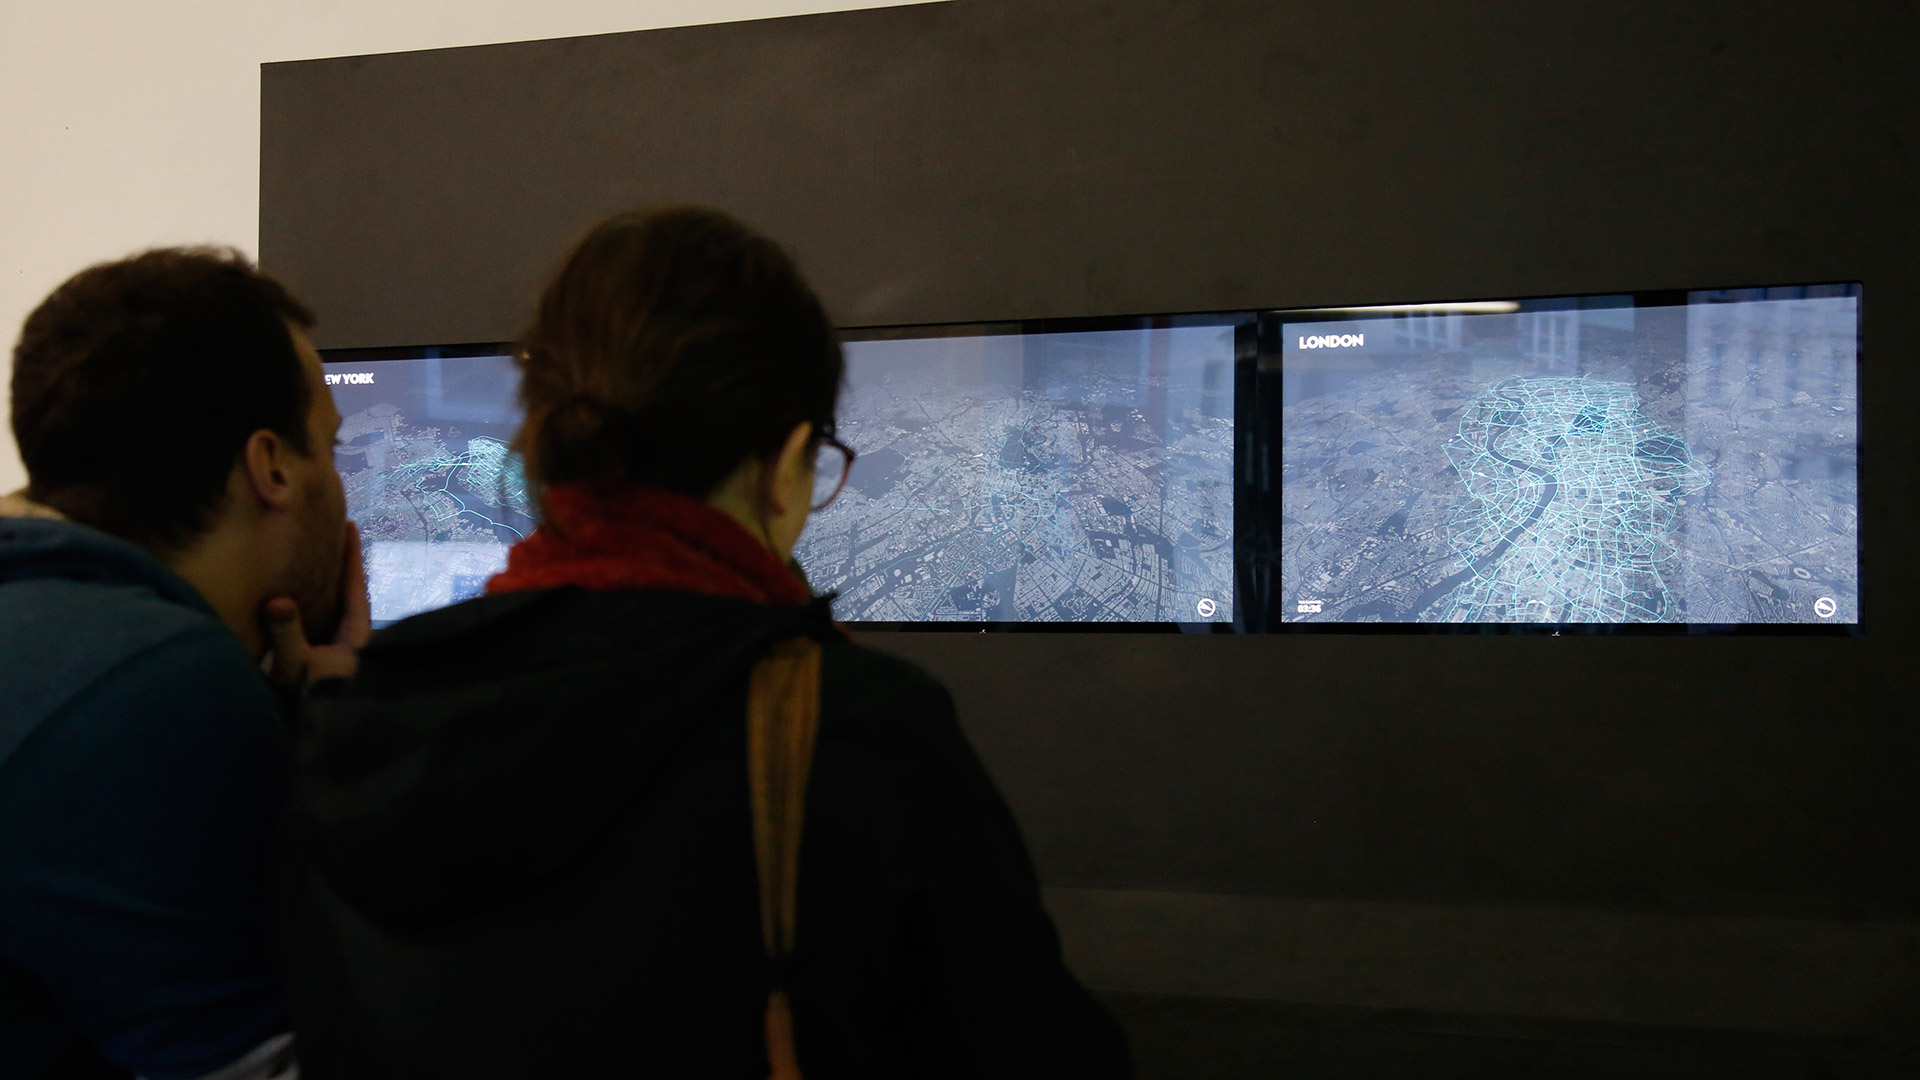
Three high-resolution screens show the space of flows of New York City, Berlin, and London through visualizing the bike-sharing systems of these global cities. By showing the flow of multiple cities side by side, visitors can compare their extent and dynamics. Tracing urban movements accentuates different urban structures, and contrasts grid-plan cities like New York with historically grown cities such as Berlin. It also enables to observe and dwell on similarities and differences in various bike-sharing systems.
This project was led by Till Nagel while being with the Urban Complexity Lab. At the HDIL, we extended this project for Rio de Janeiro and exhibited it there at Existência Numérica 2018, and at .Futuro in 2019.
High-res screens showing small-multiple views.
Visualization design
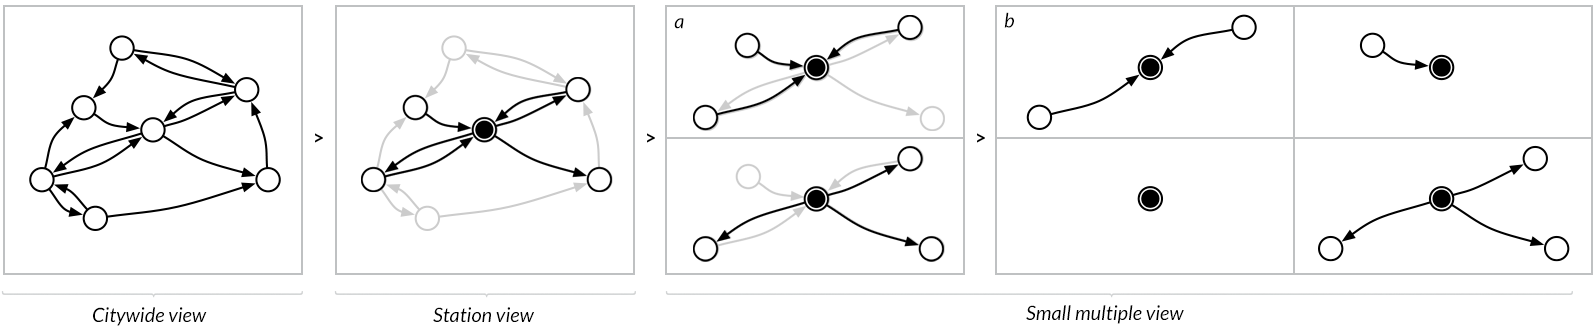
cf. city flows has three viewing modes, all visualizing trips of rented bikes, but focusing on different levels of spatial and temporal granularity of cycling mobility:
-
The citywide view aggregates all trajectories of bike-sharing trips for a given day and animates the trails for trips at a given time.
-
In the station view only the bike trips to and from a selected station are shown, allowing the distinction between incoming and outgoing.
-
A small-multiple view visualizes spatiotemporal patterns for three selected stations each in an exploded view that separates incoming from outgoing and morning from afternoon/evening trips.
Visitors can switch between these viewing modes resulting in smooth transitioning into the next scene. Each view shows an animation moving through the day and highlights bike trips of the current time with a fading trail for better visibility. The views of all three screens are temporally and spatially coordinated, showing the same time of day and having the same map scale.
Staged Analysis
We explore how citizens can be guided from evocative impressions of bicycling flows to comparative analysis of three bike-sharing systems. The main aim for visualizations in exhibition contexts is to encourage a shift from temporary interest to deeper insight into a complex phenomenon. We define Staged Analysis as a carefully choreographed process of breaking up a complex whole into its component parts and purposefully preparing the manner of their appearance.
Demonstrating Staged Analysis in cf. city flows as a staged process of transitioning between the different views showing varying levels of data and complexity in order to ease the understanding of a visualization in an exhibition space.
Find more information on the concept in our IEEE VISAP paper.
Exhibition design
For the exhibit of cf. city flows, we used three high-resolution screens (overall resolution of 7680×1440 px), and put them side by side in a custom made frame so that the screens were at eye level (see Fig. 1). We opted for displays with higher resolution and against projectors with a larger display space in order to provide crisp images even for visitors watching the visualizations up-close.
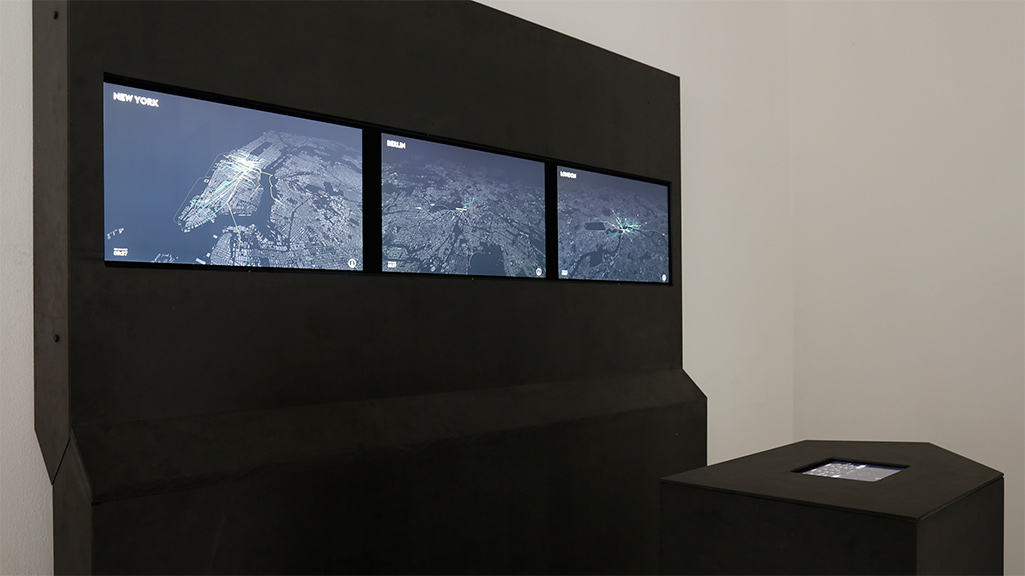
Exhibition design with the three screens and the controller column with an interactive dashboard in center front.
The touch-capable tablet featuring the dashboard shows detailed information about the bike-sharing systems. This tablet is set in a stand-alone column, placed in the center front of the three screens in such a way that a person can interact with the controller device, and observe and compare all visualizations from that same position (Fig. 3).
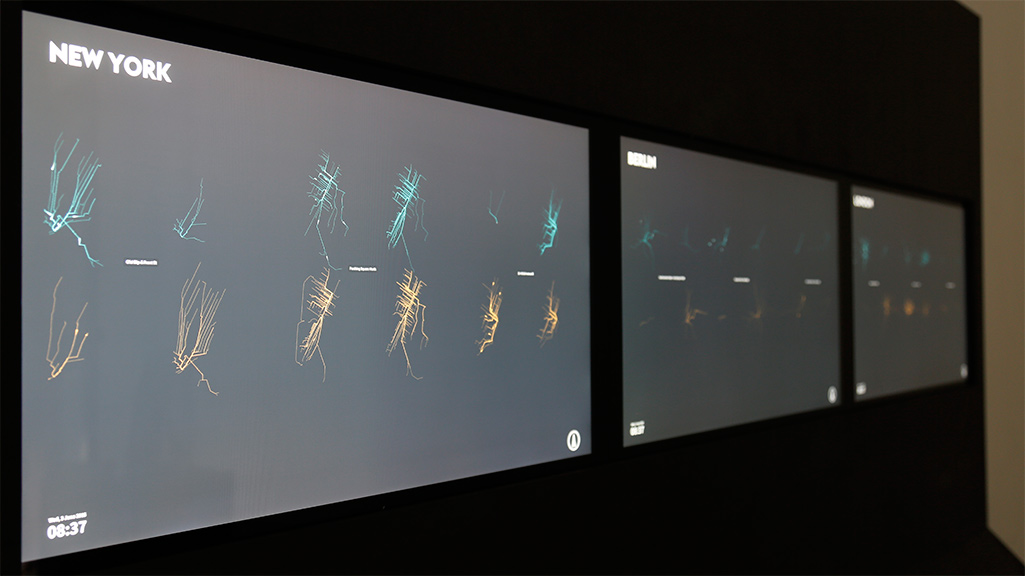
Small-multiple views showing bike riding stations with different characteristics for each city.