Happy to share two recent publications that explore how urban data visualizations can effectively engage the public.
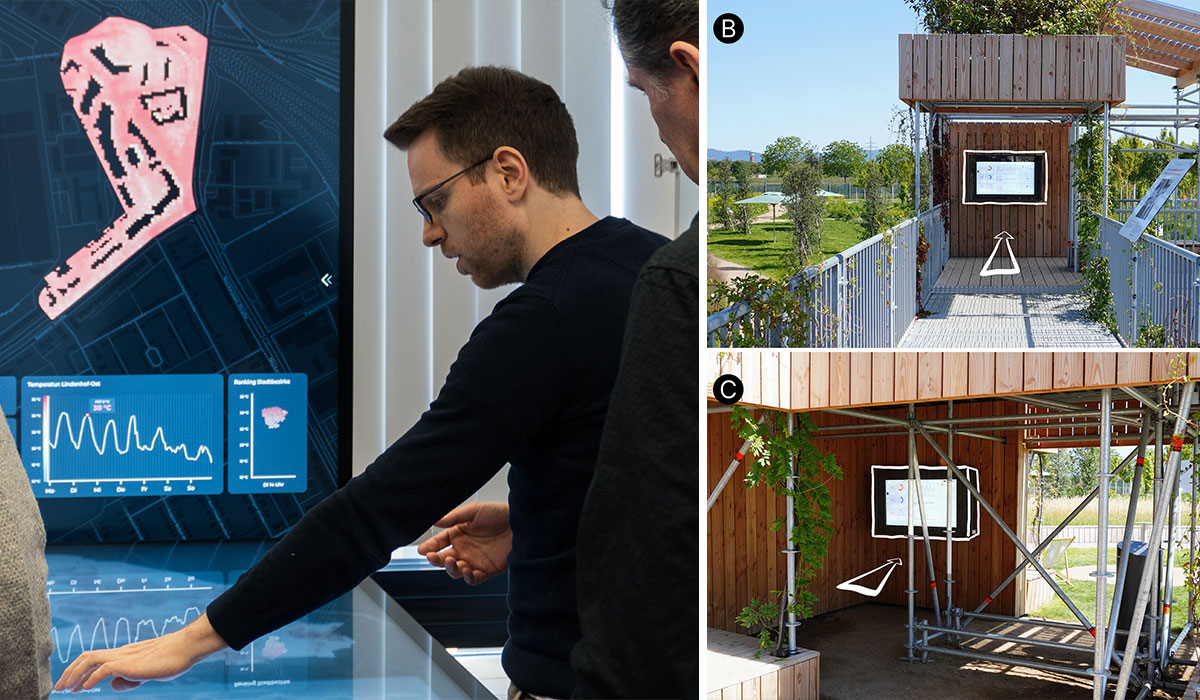
Left: People engage with the dual-screen urban climate visualization, exploring temperature data for a selected neighborhood on a midsummer day. Right: Visitors’ view of two interactive displays from different access paths in an outdoor exhibition space.
The first paper presents an interactive system for visualizing urban microclimate data, designed to help citizens explore temperature patterns in their neighborhoods. Based on a high-resolution climate model that integrates real-time sensor data, the dual-screen setup combines a citywide overview with localized detail. The visualization supports intuitive exploration and fosters climate awareness through direct interaction and contextualized comparisons.
The second paper investigates how the physical placement of large interactive displays affects visitor attention and understanding in outdoor exhibitions. Through an in-the-wild study at a public event, we observed and interviewed attendees to analyze visitor behavior and propose a typology of engagement. The findings highlight the importance of balancing visibility and tranquility when selecting locations for public data displays.
Both papers were first-authored by Christoph Huber as part of his ongoing PhD research. They were published at the EuroVis Workshop on Visualization in Environmental Sciences (EnvirVis 2025) and the International Conference on Information Visualization (IV 2025).