Crafting Futures
Embedded AR Visualizations for Transforming Urban Spaces.
The “Crafting Futures” project combines Augmented Reality (AR) and generative AI to make climate change impacts on urban areas visible and immersive, embedding visualizations of current and future urban data directly into cityscapes. Led by the Human Data Interaction Lab in collaboration with the Chair of Digitalization, Visualization, and Monitoring in Spatial Planning at the University of Kaiserslautern-Landau (RPTU) and the SmartCity Living Lab at the German Research Center for Artificial Intelligence (DFKI), the initiative is supported by the Carl Zeiss Foundation.
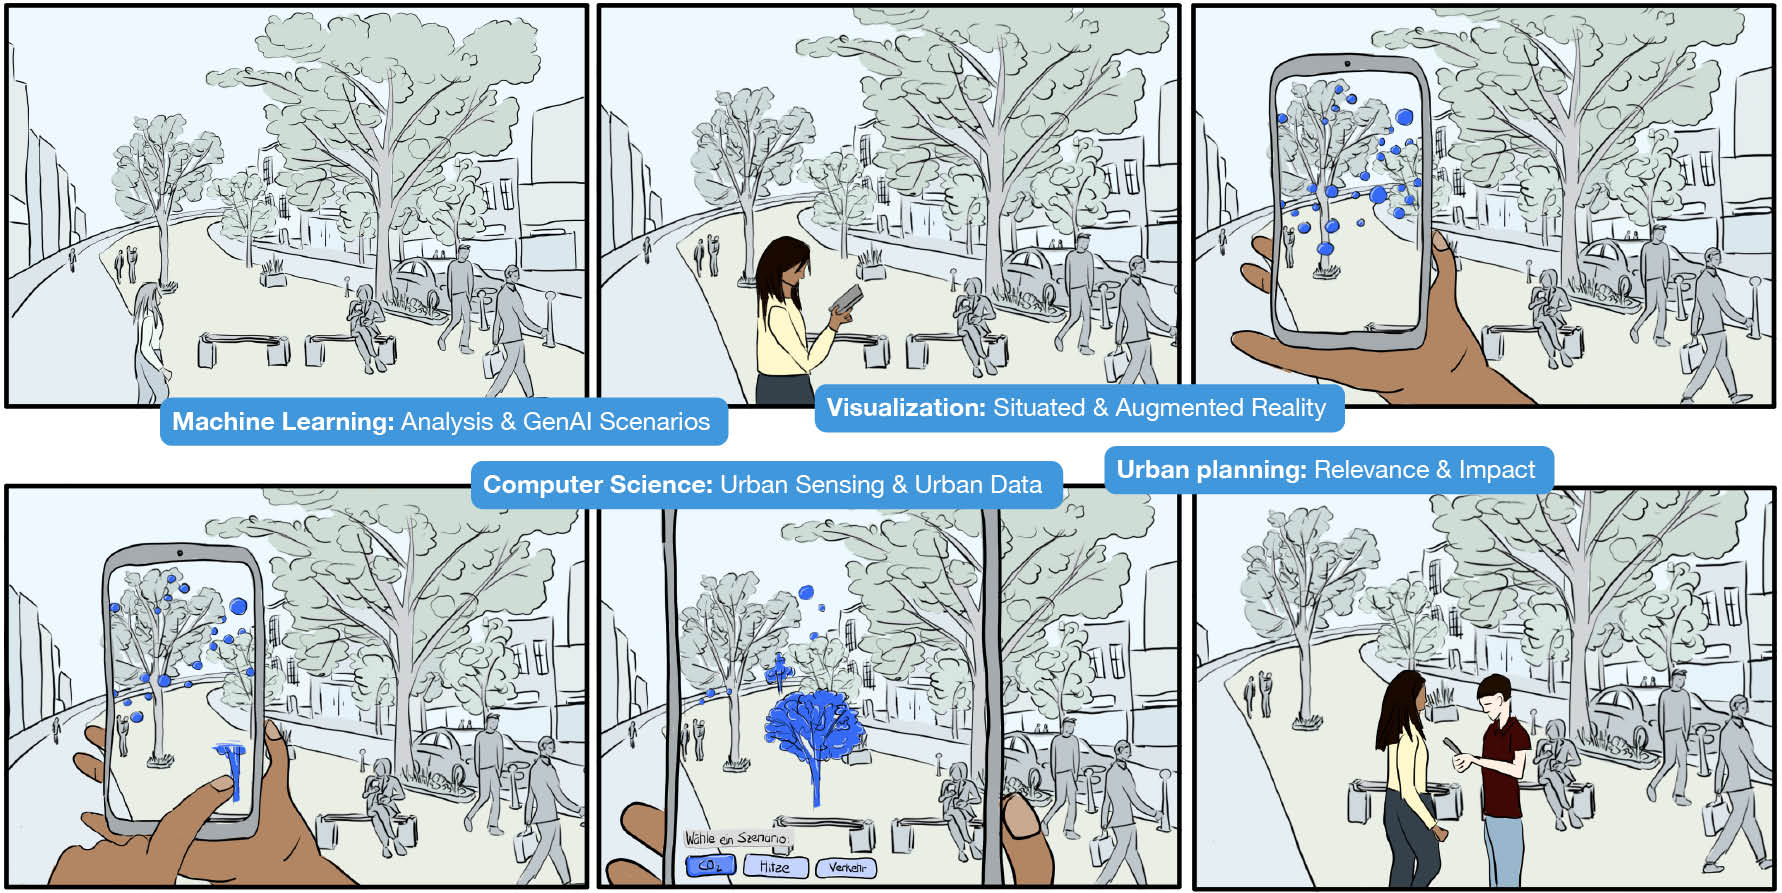
Storyboard of an example scenario in our research project: Sophie checks the air quality in front of her house in real-time using her smartphone. With a quick gesture, she suggests sustainable measures and discusses their potential impacts with her neighbor Ben.
Design space for embedding urban visualizations
As a foundation for Crafting Futures, we developed a comprehensive design space for embedded data visualizations in urban environments. Drawing from situated visualization theory, urban informatics, and co-creative workshops with designers and planners, we identified key dimensions that shape how visualizations interact with physical space and viewers. These dimensions help us understand different contextual factors—from the scale of the visualization to how people physically engage with it—and guide how we represent complex climate data in the urban landscape. The design space gives us a shared vocabulary for thinking through design decisions and exploring new possibilities for what embedded urban visualizations could become.
Design space dimensions for embedded data visualizations in urban environments.
Read more about the design space and speculative exemplars in our paper Toward a Design Space for Embedded Urban Data Visualizations.
Evaluating local heat visualizations in situ
To test the design space in practice, we focused on a concrete challenge: helping people understand hyperlocal climate phenomena. Most existing climate visualizations miss the small-scale variations that matter most at street level—a pocket of intense heat caused by pavement, or cooler air near trees. We created several prototypical visualizations showing hyperlocal temperature data and tested them in the field using an AR design probe in a real urban environment. By combining quantiative with quantitative feedback, we explored how different ways of encoding the data and anchoring it to the environment affected how people perceived and understood the climate variations. This revealed important design tensions such as the balance between showing local precision and enabling broader comparisons, or between visual clarity and avoiding obstruction of the view.
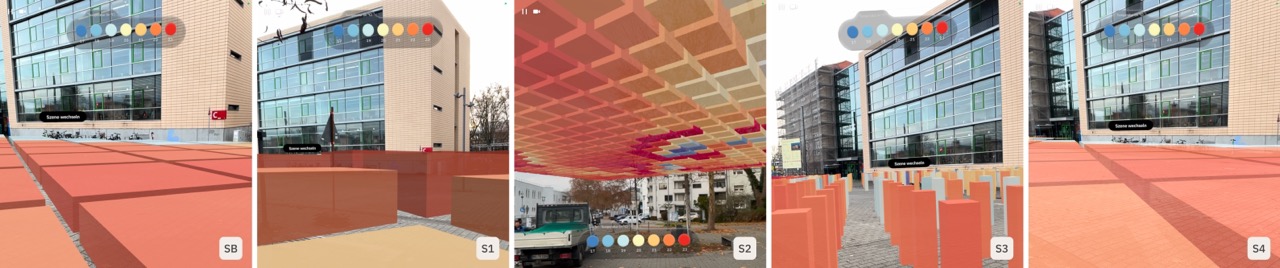
Five variants of embedded climate visualizations tested in situ: SB shows the baseline visualization idiom, encoding temperature through color only. S1 additionally encodes temperature through varying heights, S2 anchors the visualization in the sky, S3 increases the gap between visual elements, and S4 reduces translucency of the colored bars.
Find study details and our findings in our paper Embedding Climate Data Into Urban Space: A Situated AR Design Probe.
Background
The way cities are designed—and how we move through them every day—contributes to a host of significant, interconnected issues, from accelerating climate change to stressing urban systems in ways that are hard to ignore. What’s interesting is that we already know how cities need to transform to stay livable, or even habitable, in the future. The research is solid, and the data is there. But here’s the catch: while we understand that reshaping cities and shifting daily behaviors could make a major impact—cutting mobility-related CO2 emissions, mitigating extreme heat, or managing urban flooding—action lags when the problem feels abstract.
People respond when they can see and feel a threat. But as long as the causes and effects of these urban challenges remain invisible or theoretical, meaningful action tends to be delayed. Think about it: we know fossil-fuel-based transportation is a major source of CO2, but it’s invisible. Urban heat islands have hit some cities hard recently, but forecasts for 2040? They’re still hypothetical. So, what if we could flip that script? Imagine walking down your street and being able to see the CO2 from passing cars, or visualize the heat stress that your neighborhood could experience. That’s where Crafting Futures comes in. This project introduces a groundbreaking way to bridge that gap between knowledge and action using situated visualizations in augmented reality (AR). By embedding real-time and future data directly into the urban landscape, citizens can experience the invisible forces shaping their environment. With a smartphone, tablet, or AR glasses, you can explore the city from any perspective you choose and start to grasp the complex interconnections that drive these challenges. But Crafting Futures doesn’t stop at showing you the data. It goes further, offering an interactive tool to shape the future. Want to experiment with urban planning? With just a few swipes, you can modify streetscapes, and a generative AI instantly integrates these changes into the city’s fabric. You can then see, in real time, how those tweaks affect CO2 emissions, local temperatures, and more.
This project weaves together environmental science, mathematical modeling, and urban design in a deeply interdisciplinary approach. But beyond the technical challenges, it addresses something more fundamental: how understanding complex systems can drive societal shifts. By making the invisible visible, Crafting Futures sparks the kind of engagement that leads to new ways of thinking—and, crucially, acting.